Auditing iRODS with the Audit Plugin and Elastic Stack
This post presents a way to audit your iRODS grid using the Audit plugin and the Elastic Stack (Logstash, Kibana, and Elasticsearch).
Overview
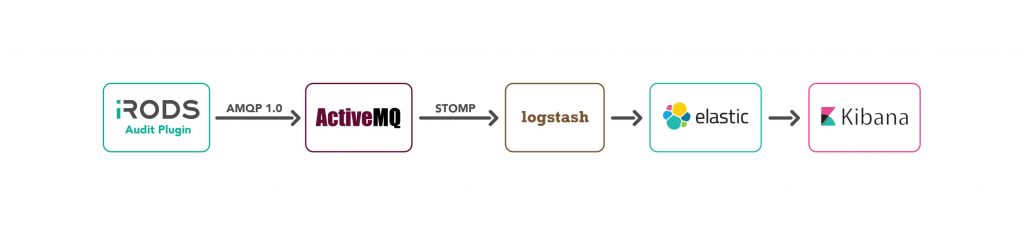
The audit plugin is installed within iRODS and executes whenever a dynamic policy enforcement point (PEP) is fired. The plugin generates an AMQP message for each dynamic PEP with information about the current execution state available to the PEP.
These AMQP message are sent to a message broker. Below we demonstrate a setup with either Apache ActiveMQ or Apache Apollo. Logstash is configured to receive these messages via the stomp protocol and pass them on to Elasticsearch which stores and indexes these. Finally Kibana is used to query this database and present useful information about your iRODS grid.
Note: In this post all the components will be running on the iCAT server. These components can be distributed to multiple servers by updating the references from "localhost" to the appropriate server domain name in the various configuration files.
Building and Installing the Audit Rule Engine Plugin
Before you can build the Audit plugin, you will need to download the iRODS dependencies. Perform the following steps to set up your system to use the iRODS repository, get the iRODS externals, and set your PATH to use the correct version of CMake.
wget -qO - https://core-dev.irods.org/irods-core-dev-signing-key.asc | sudo apt-key add -
echo "deb [arch=amd64] https://core-dev.irods.org/apt/ $(lsb_release -sc) main" | sudo tee /etc/apt/sources.list.d/renci-irods-core-dev.list
sudo apt-get update
sudo apt-get install -y irods-externals*
sudo apt-get install -y irods-dev
sudo apt-get install -y g++
sudo apt-get install -y qpid-client
export PATH=/opt/irods-externals/cmake3.5.2-0/bin:$PATH
Next clone the repository and build and install the audit rule engine plugin.
git clone https://github.com/irods/irods_rule_engine_plugin_audit_amqp
cd irods_rule_engine_plugin_audit_amqp
mkdir build
cd build
cmake ..
make package
sudo dpkg -i irods-rule-engine-plugin-audit-amqp-4.2.0-ubuntu14-x86_64.deb
The final step is to update the /etc/irods/server_config.json to use the rule engine plugin. Edit this file as either root or irods and add the following in the rule_engines array.
{
 "instance_name": "irods_rule_engine_plugin-audit_amqp-instance",
 "plugin_name": "irods_rule_engine_plugin-audit_amqp",
 "plugin_specific_configuration" : {
   "pep_regex_to_match" : "audit_.*",
   "amqp_topic" : "queue://audit_messages",
   "amqp_location" : "ANONYMOUS@localhost:5672",
   "amqp_options" : ""
   }
}
Also add "audit_" in the rule_engine_namespaces as shown below.
    "rule_engine_namespaces": [
        "",
        "audit_"
    ],
Notes:
- If you are using a default version of server_config.json, this will follow the irods_rule_engine_plugin-irods_rule_language-instance rule engine entry.
- Remember to add a comma after this closing curly bracket for the previous rule entry.
- We are using an AMQP queues. If a topic is desired change "queue://" to "topic://".
Now the audit rule engine will be enabled and will be attempting to send AMQP messages.
Installing a Message Broker
At this point the messages will not be delivered successfully because a message broker has not been created. We will show a couple of examples of message brokers than can be used.
Option 1: Apache ActiveMQ
To download and start ActiveMQ perform the following steps:
wget http://archive.apache.org/dist/activemq/5.13.2/apache-activemq-5.13.2-bin.tar.gz
gunzip apache-activemq-5.13.2-bin.tar.gz
tar xvf apache-activemq-5.13.2-bin.tar
cd apache-activemq-5.13.2/bin
./activemq start
Go to http://localhost:8161/admin/ (the default login/password is admin/admin) and click on the "Queues" link to view the queues. Perform some iCommands (ils, etc.) on the iCAT server and messages should be enqueued on the "audit_messages" queue.
Note: Since there are currently no listeners for this queue, these messages will remain on the queue until a listener reads them.
Option 2: Apache Apollo
Download Apache Apollo and create an instance of the broker:
cd ~
wget http://mirrors.sonic.net/apache/activemq/activemq-apollo/1.7.1/apache-apollo-1.7.1-unix-distro.tar.gz
gunzip apache-apollo-1.7.1-unix-distro.tar.gz
tar xvf apache-apollo-1.7.1-unix-distro.tar
apache-apollo-1.7.1/bin/apollo create irods.example.org
Disable authentication on the broker by removing the comments from the following line in irods.example.org/etc/apollo.xml:
<authentication enabled="false"/>
Add AMQP connectors after the existing connectors in irods.example.org/etc/apollo.xml:
<connector id="amqp" bind="tcp://0.0.0.0:5672"/>
<connector id="amqps" bind="ssl://0.0.0.0:5671"/>
Create the broker as a service and start it.
sudo ln -s "~/irods.example.org/bin/apollo-broker-service" /etc/init.d/
sudo service apollo-broker-service start
Go to http://localhost:61680/console/index.html (the default login/password is admin/password) and click on the "Queues" link to view the queues. Perform some iCommands (ils, etc.) on the iCAT server and messages should be enqueued on the "audit_messages" queue.
Installing Elasticsearch
Elasticsearch will be the database used to store and index all of the dynamic PEP information. Perform the following steps to install and start Elasticsearch:
echo "deb http://packages.elastic.co/elasticsearch/2.x/debian stable main" | sudo tee -a /etc/apt/sources.list.d/elasticsearch-2.x.list
sudo apt-get update
sudo apt-get --force-yes install elasticsearch
sudo service elasticsearch restart
Let's go ahead and set up an index on Elasticsearch and make sure the hostname field is not analyzed. This will allow us to group data by hostname without getting funny results.
curl -XPUT 'http://localhost:9200/audit_log'
curl -XPUT localhost:9200/audit_log/_mapping/hostname_mapping -d '
{
  "properties": {
    "hostname": {
       "type": "string",
      "index": "not_analyzed"
    }
  }
}'
Installing Logstash
Logstash will be used to read the messages from the ActiveMQ message broker, transform them, and store them in Elasticsearch. Install Logstash and the stomp plugin:
wget -qO - https://packages.elastic.co/GPG-KEY-elasticsearch | sudo apt-key add -
echo "deb http://packages.elastic.co/logstash/2.1/debian stable main" | sudo tee -a /etc/apt/sources.list.d/logstash-2.x.list
sudo apt-get update
sudo apt-get install logstash
cd /opt/logstash/bin/

# install logstash-input-stomp plugin
sudo ./plugin install logstash-input-stomp
The next step is to configure Logstash. As super-user, create the file /opt/logstash/bin/audit.conf with the following contents:
input {
    # Read the audit_messages queue messages using the stomp protocol.
    stomp {
        host        => "localhost"
        destination => "/queue/audit_messages"
        codec       => plain {
                           charset => "ISO-8859-1"
                       }
    }

}

filter {

    # Remove AMQP header and footer information from message
    # Logstash < 5.0
    ruby {
        code => " event['message'].sub!(/.*__BEGIN_JSON__/, '')
                  event['message'].sub!(/__END_JSON__.*/, '')
                "
    }

    # Logstash >= 5.0
    #
    #        code => " event.set('message',event.get('message').sub(/.*__BEGIN_JSON__/, ''))
    #                  event.set('message',event.get('message').sub(/__END_JSON__.*/, ''))
    #                "

    # Parse the JSON message
    json {
        source       => "message"
        remove_field => ["message"]
    }

    # Replace @timestamp with the timestamp stored in time_stamp
    date {
        match => [ "time_stamp", "UNIX_MS" ]
    }

    # Convert select fields to integer
    mutate {
        convert => { "int" => "integer" }
        convert => { "int__2" => "integer" }
        convert => { "int__3" => "integer" }
        convert => { "file_size" => "integer" }
    }
}

output {
    # Write the output to elastic search under the audit_log index.
    elasticsearch {
        hosts => ["localhost:9200"]
        index => "audit_log"
    }
    stdout {
        codec => rubydebug {
        }
    }
}
Logstash configuration files have three parts: input, filter, and output.
- The input section configures Logstash to read the messages from the "audit_messages" queue.
- The ruby section in the filter updates the "message" field to remove some AMQP header information from this field. What is left should be a JSON formatted string.
- The json section parses the JSON in the message field and creates output fields corresponding to the JSON fields.
- The date section replaces the @timestamp field with the timestamp stored in 0__time_stamp.
- The mutate section converts some select strings to integers so they will have the appropriate data type in Elasticsearch.
- The output writes the resulting information to Elasticsearch under the "audit_log" index.
- The stdout writes the resulting output in an easily readable format to the stdout. This can be commented out once debugging is finished.
Next, start Logstash.
cd /opt/logstash/bin
./logstash -f audit.conf
Perform some iCommands (ils, iput, etc.). If everything is configured properly you should see messages written to stdout where Logstash was started. Also examine the ActiveMQ queue and verify that Logstash has dequeued all of the messages.
At this point the information should be written to the Elasticsearch database. You can use curl to verify this:
To query for rule name and pid for all database open pre PEPs:
curl -XGET 'localhost:9200/audit_log/_search' -d '{
    "fields": [ "3__rule_name", "2__pid" ],
   "size": "100",
   "query": {
      "term": { "3__rule_name": "audit_pep_database_open_pre"}
   }
}'
To query all fields for database open pre PEPs:
curl 'localhost:9200/audit_log/_search?q=3__rulename=audit_pep_database_gen_query_pre'
Installing and Setting Up a Dashboard in Kibana
Kibana is used to query and display information graphically from our Elasticsearch database. We will use a Kibana dashboard to monitor our iRODS grid.
Install Kibana and start:
echo "deb http://packages.elastic.co/kibana/4.4/debian stable main" | sudo tee -a /etc/apt/sources.list.d/kibana-4.4.x.list
sudo apt-get update
sudo apt-get -y install kibana
sudo service kibana start
Access the Kibana web portal using the following URL: http://localhost:5601
The following is a sample dashboard to demonstrate what can be done in Kibana. Save this in a file called irods_dashboard.json:
[
  {
    "_id": "Sample-iRODS-Dashboard",
    "_type": "dashboard",
    "_source": {
      "title": "Sample iRODS Dashboard",
      "hits": 0,
      "description": "",
      "panelsJSON": "[{\"col\":1,\"id\":\"Connections-Per-Minute\",\"panelIndex\":3,\"row\":1,\"size_x\":6,\"size_y\":4,\"type\":\"visualization\"},{\"col\":7,\"id\":\"Unique-Users-Per-Minute\",\"panelIndex\":4,\"row\":1,\"size_x\":6,\"size_y\":4,\"type\":\"visualization\"},{\"col\":1,\"id\":\"Bytes-Written-Per-Minute\",\"panelIndex\":5,\"row\":5,\"size_x\":6,\"size_y\":3,\"type\":\"visualization\"},{\"col\":7,\"id\":\"Bytes-Read-Per-Minute\",\"panelIndex\":6,\"row\":5,\"size_x\":6,\"size_y\":3,\"type\":\"visualization\"},{\"col\":1,\"id\":\"Top-Client-IPs\",\"panelIndex\":7,\"row\":8,\"size_x\":6,\"size_y\":4,\"type\":\"visualization\"},{\"col\":7,\"id\":\"Top-Users\",\"panelIndex\":8,\"row\":8,\"size_x\":6,\"size_y\":4,\"type\":\"visualization\"}]",
      "optionsJSON": "{\"darkTheme\":true}",
      "uiStateJSON": "{}",
      "version": 1,
      "timeRestore": false,
      "kibanaSavedObjectMeta": {
        "searchSourceJSON": "{\"filter\":[{\"query\":{\"query_string\":{\"analyze_wildcard\":true,\"query\":\"*\"}}}]}"
      }
    }
  },
  {
    "_id": "Bytes-Read-Per-Minute",
    "_type": "visualization",
    "_source": {
      "title": "Bytes Read Per Minute",
      "visState": "{\"title\":\"Bytes Read Per Minute\",\"type\":\"histogram\",\"params\":{\"shareYAxis\":true,\"addTooltip\":true,\"addLegend\":true,\"scale\":\"linear\",\"mode\":\"stacked\",\"times\":[],\"addTimeMarker\":false,\"defaultYExtents\":false,\"setYExtents\":false,\"yAxis\":{}},\"aggs\":[{\"id\":\"1\",\"type\":\"sum\",\"schema\":\"metric\",\"params\":{\"field\":\"int\"}},{\"id\":\"2\",\"type\":\"date_histogram\",\"schema\":\"segment\",\"params\":{\"field\":\"@timestamp\",\"interval\":\"m\",\"customInterval\":\"2h\",\"min_doc_count\":1,\"extended_bounds\":{}}},{\"id\":\"3\",\"type\":\"terms\",\"schema\":\"group\",\"params\":{\"field\":\"hostname\",\"size\":10,\"order\":\"desc\",\"orderBy\":\"_term\"}}],\"listeners\":{}}",
      "uiStateJSON": "{}",
      "description": "",
      "version": 1,
      "kibanaSavedObjectMeta": {
        "searchSourceJSON": "{\"index\":\"audit_log\",\"query\":{\"term\":{\"rule_name\":\"audit_pep_resource_read_post\"}},\"filter\":[]}"
      }
    }
  },
  {
    "_id": "Top-Users",
    "_type": "visualization",
    "_source": {
      "title": "Top Users",
      "visState": "{\"title\":\"Top Users\",\"type\":\"line\",\"params\":{\"addLegend\":true,\"addTimeMarker\":false,\"addTooltip\":true,\"defaultYExtents\":false,\"drawLinesBetweenPoints\":true,\"interpolate\":\"linear\",\"radiusRatio\":9,\"scale\":\"linear\",\"setYExtents\":false,\"shareYAxis\":true,\"showCircles\":true,\"smoothLines\":false,\"times\":[],\"yAxis\":{}},\"aggs\":[{\"id\":\"1\",\"type\":\"count\",\"schema\":\"metric\",\"params\":{}},{\"id\":\"3\",\"type\":\"terms\",\"schema\":\"group\",\"params\":{\"field\":\"user_user_name\",\"size\":5,\"order\":\"desc\",\"orderBy\":\"1\"}},{\"id\":\"4\",\"type\":\"date_histogram\",\"schema\":\"segment\",\"params\":{\"field\":\"@timestamp\",\"interval\":\"m\",\"customInterval\":\"2h\",\"min_doc_count\":1,\"extended_bounds\":{}}}],\"listeners\":{}}",
      "uiStateJSON": "{}",
      "description": "",
      "version": 1,
      "kibanaSavedObjectMeta": {
        "searchSourceJSON": "{\"index\":\"audit_log\",\"query\":{\"term\":{\"rule_name\":\"audit_pep_auth_agent_auth_request_pre\"}},\"filter\":[]}"
      }
    }
  },
  {
    "_id": "Unique-Users-Per-Minute",
    "_type": "visualization",
    "_source": {
      "title": "Unique Users Per Minute",
      "visState": "{\"title\":\"Unique Users Per Minute\",\"type\":\"line\",\"params\":{\"shareYAxis\":true,\"addTooltip\":true,\"addLegend\":true,\"showCircles\":true,\"smoothLines\":false,\"interpolate\":\"linear\",\"scale\":\"linear\",\"drawLinesBetweenPoints\":true,\"radiusRatio\":9,\"times\":[],\"addTimeMarker\":false,\"defaultYExtents\":false,\"setYExtents\":false,\"yAxis\":{}},\"aggs\":[{\"id\":\"1\",\"type\":\"cardinality\",\"schema\":\"metric\",\"params\":{\"field\":\"user_user_name\"}},{\"id\":\"2\",\"type\":\"date_histogram\",\"schema\":\"segment\",\"params\":{\"field\":\"@timestamp\",\"interval\":\"m\",\"customInterval\":\"2h\",\"min_doc_count\":1,\"extended_bounds\":{}}},{\"id\":\"3\",\"type\":\"terms\",\"schema\":\"group\",\"params\":{\"field\":\"hostname\",\"size\":10,\"order\":\"desc\",\"orderBy\":\"_term\"}}],\"listeners\":{}}",
      "uiStateJSON": "{}",
      "description": "",
      "version": 1,
      "kibanaSavedObjectMeta": {
        "searchSourceJSON": "{\"index\":\"audit_log\",\"query\":{\"term\":{\"rule_name\":\"audit_pep_auth_agent_auth_request_pre\"}},\"filter\":[]}"
      }
    }
  },
  {
    "_id": "Connections-Per-Minute",
    "_type": "visualization",
    "_source": {
      "title": "Connections Per Minute",
      "visState": "{\"title\":\"Connections Per Minute\",\"type\":\"line\",\"params\":{\"addLegend\":true,\"addTimeMarker\":false,\"addTooltip\":true,\"defaultYExtents\":false,\"drawLinesBetweenPoints\":true,\"interpolate\":\"linear\",\"radiusRatio\":9,\"scale\":\"linear\",\"setYExtents\":false,\"shareYAxis\":true,\"showCircles\":true,\"smoothLines\":false,\"times\":[],\"yAxis\":{}},\"aggs\":[{\"id\":\"1\",\"type\":\"count\",\"schema\":\"metric\",\"params\":{}},{\"id\":\"2\",\"type\":\"date_histogram\",\"schema\":\"segment\",\"params\":{\"field\":\"@timestamp\",\"interval\":\"m\",\"customInterval\":\"2h\",\"min_doc_count\":1,\"extended_bounds\":{},\"json\":\"\"}},{\"id\":\"3\",\"type\":\"terms\",\"schema\":\"group\",\"params\":{\"field\":\"hostname\",\"size\":10,\"order\":\"desc\",\"orderBy\":\"_term\"}}],\"listeners\":{}}",
      "uiStateJSON": "{}",
      "description": "",
      "version": 1,
      "kibanaSavedObjectMeta": {
        "searchSourceJSON": "{\"index\":\"audit_log\",\"query\":{\"term\":{\"rule_name\":\"audit_pep_auth_agent_auth_request_pre\"}},\"filter\":[]}"
      }
    }
  },
  {
    "_id": "Bytes-Written-Per-Minute",
    "_type": "visualization",
    "_source": {
      "title": "Bytes Written Per Minute",
      "visState": "{\"title\":\"Bytes Written Per Minute\",\"type\":\"histogram\",\"params\":{\"addLegend\":true,\"addTimeMarker\":false,\"addTooltip\":true,\"defaultYExtents\":false,\"mode\":\"stacked\",\"scale\":\"linear\",\"setYExtents\":false,\"shareYAxis\":true,\"times\":[],\"yAxis\":{}},\"aggs\":[{\"id\":\"1\",\"type\":\"sum\",\"schema\":\"metric\",\"params\":{\"field\":\"int\"}},{\"id\":\"2\",\"type\":\"date_histogram\",\"schema\":\"segment\",\"params\":{\"field\":\"@timestamp\",\"interval\":\"m\",\"customInterval\":\"2h\",\"min_doc_count\":1,\"extended_bounds\":{}}},{\"id\":\"3\",\"type\":\"terms\",\"schema\":\"group\",\"params\":{\"field\":\"hostname\",\"size\":10,\"order\":\"desc\",\"orderBy\":\"_term\"}}],\"listeners\":{}}",
      "uiStateJSON": "{}",
      "description": "",
      "version": 1,
      "kibanaSavedObjectMeta": {
        "searchSourceJSON": "{\"index\":\"audit_log\",\"query\":{\"term\":{\"rule_name\":\"audit_pep_resource_write_post\"}},\"filter\":[]}"
      }
    }
  },
  {
    "_id": "Top-Client-IPs",
    "_type": "visualization",
    "_source": {
      "title": "Top Client IPs",
      "visState": "{\"aggs\":[{\"id\":\"1\",\"params\":{},\"schema\":\"metric\",\"type\":\"count\"},{\"id\":\"3\",\"params\":{\"field\":\"client_addr\",\"order\":\"desc\",\"orderBy\":\"1\",\"size\":5},\"schema\":\"group\",\"type\":\"terms\"},{\"id\":\"4\",\"params\":{\"customInterval\":\"2h\",\"extended_bounds\":{},\"field\":\"@timestamp\",\"interval\":\"m\",\"min_doc_count\":1},\"schema\":\"segment\",\"type\":\"date_histogram\"}],\"listeners\":{},\"params\":{\"addLegend\":true,\"addTimeMarker\":false,\"addTooltip\":true,\"defaultYExtents\":false,\"drawLinesBetweenPoints\":true,\"interpolate\":\"linear\",\"radiusRatio\":9,\"scale\":\"linear\",\"setYExtents\":false,\"shareYAxis\":true,\"showCircles\":true,\"smoothLines\":false,\"times\":[],\"yAxis\":{}},\"title\":\"Top Client IPs\",\"type\":\"line\"}",
      "uiStateJSON": "{}",
      "description": "",
      "version": 1,
      "kibanaSavedObjectMeta": {
        "searchSourceJSON": "{\"index\":\"audit_log\",\"query\":{\"term\":{\"rule_name\":\"audit_pep_auth_agent_auth_request_pre\"}},\"filter\":[]}"
      }
    }
  }
]
In the Kibana web portal, perform the following tasks:
- Select Settings->Indices, update the index name or pattern to "audit_log". Tab out of this text field (to enable the create button) and click the create button.
- Select Settings->Objects->Import and load irods_dashboard.json.
- Click on the eye icon next to the "Sample iRODS Dashboard".
* Note: If you get an error on input stating "Could not locate that index-pattern-field, it is likely because an iget and iput haven't been executed and certain database fields that are used by the visualizations have not yet been created. Perform an iget and iput, click Settings->Indices, click the "audit_log" index, and hit the orange refresh button at the top of the screen.*
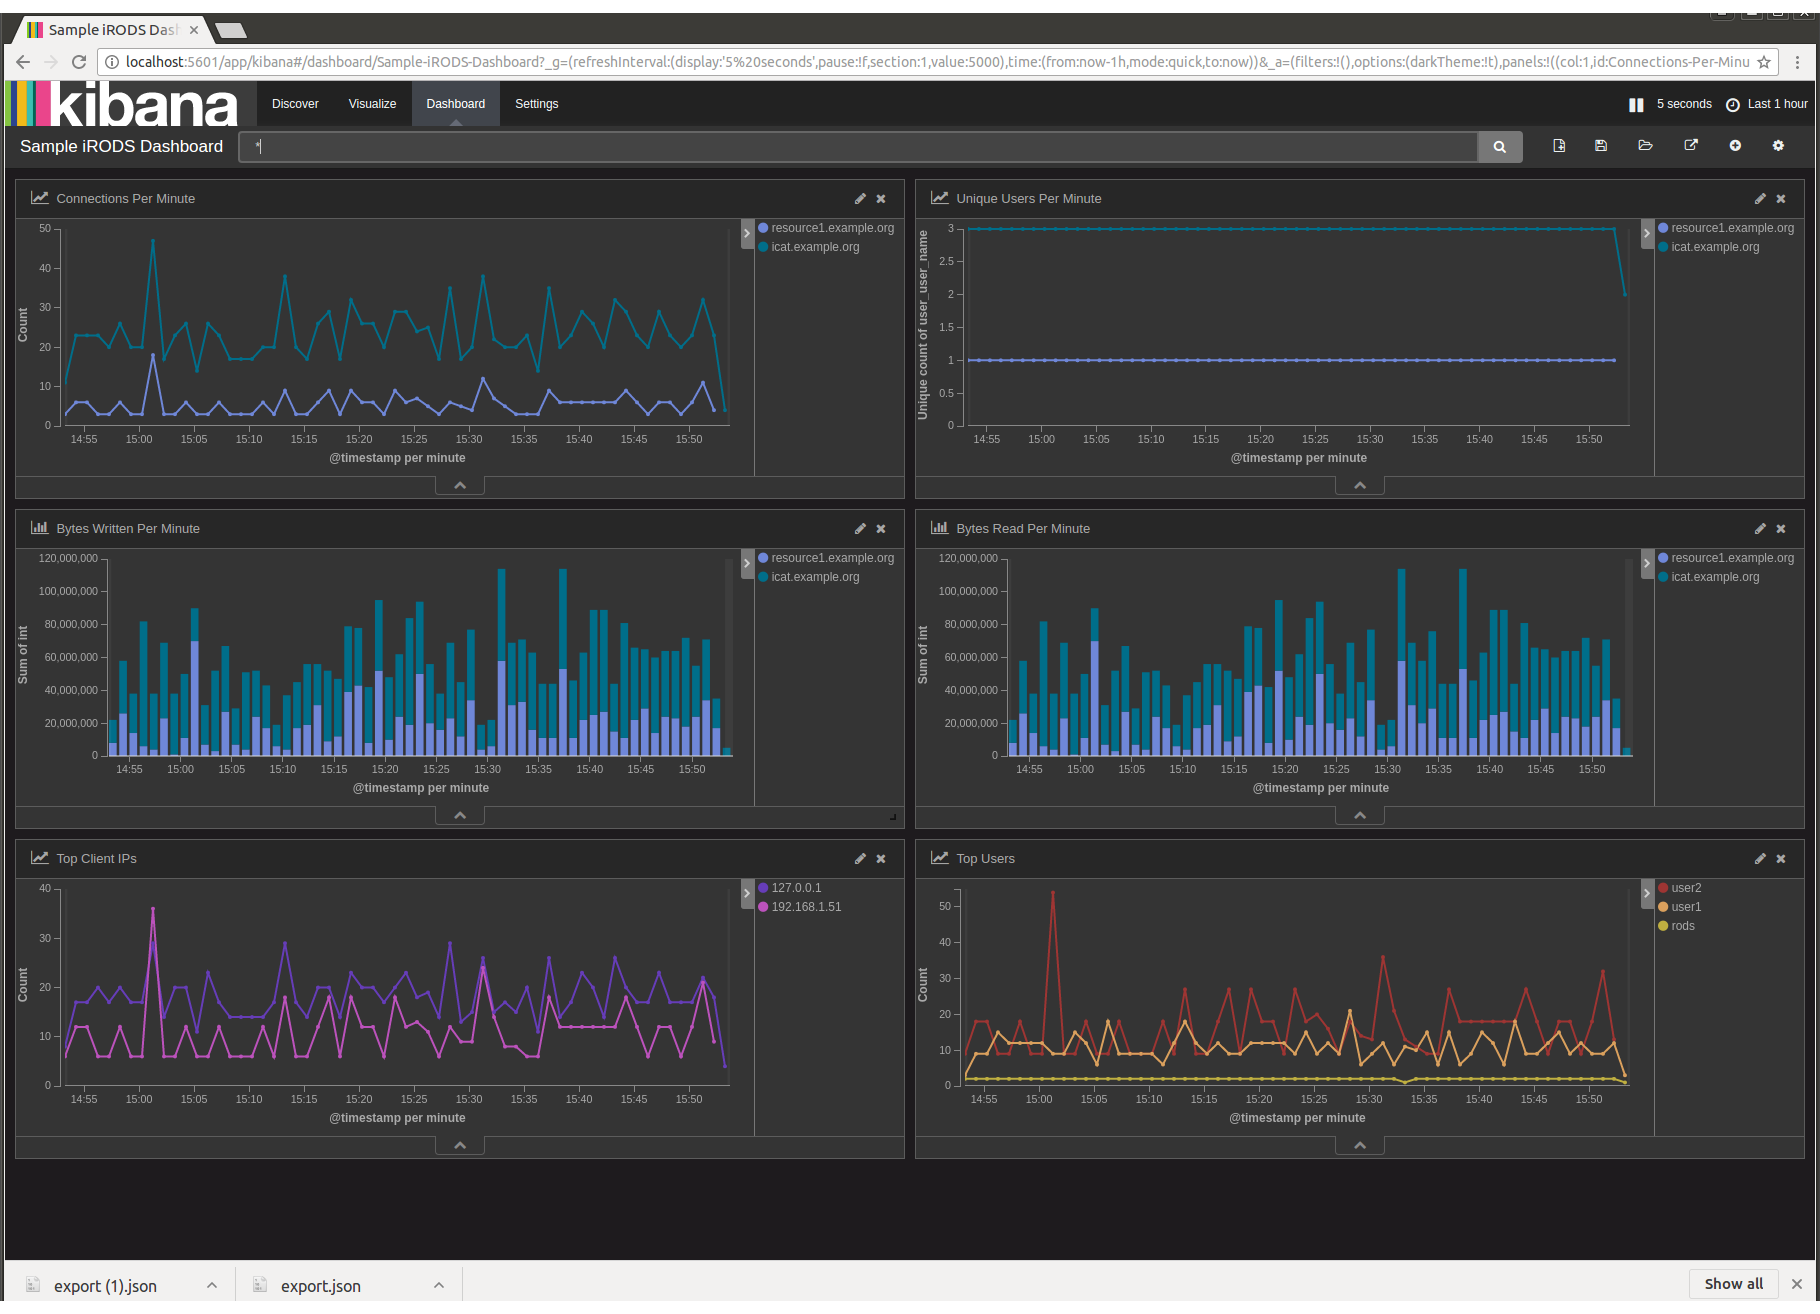
You should see a sample dashboard with the following:
- A line graph with the number of connections per minute.
- A line graph with the number of unique users per minute.
- A bar graph of the number of bytes written per minute per server.
- A bar graph of the number of bytes read per minute per server.
- A line graph of the number of connections per minute per IP address.
- A line graph of the number of connections per minute per user.
Justin James